PROJECT: guiltTrip()
Overview
Craving for a nice bowl of Mala but can’t seem to save up enough for it? guiltTrip() is the perfect platform for those aspiring to be able to afford their Mala, finally!
Summary of contributions
Data Presentation:
-
Major enhancement: added Statistics Breakdown along with Categories
-
What it does: allows the user to view the statistics of his spending, whether it be by daily through a bar chart or by category through a table or pie chart. To facilitate the User’s experience, categories are also introduce to allow breakdown by categories.
-
Justification: This feature improves the product significantly because it helps the user to identify and notice his/her spending across categories , thus finding out his spending trends and identify how to improve from there.
-
Highlights: This feature involves calculation of statistics across a period of time, and hence requires an understanding of how the entries are saved to carry out calculation operations on them.
-
-
Minor enhancement: added Quality Of Life Features:Sort and Find Command
-
What it does: Allows the user to sort the list according to the fields of the entry. Also allows the user to find specific entries. Enhanced the find command of original AddressBook to include allowing it to find for all fields of the entry.
-
Justification: This feature improves the product as there is more Data Organization and the user can choose what data to see through find.
-
Highlights: This feature involves sorting the exiting list of entries and filtering them, and hence requires an understanding of how the entries are saved to carry out calculation operations on them.
-
-
Code contributed: Functional code
-
Other contributions:
-
Project management:
-
Managed releases
v1.1-v1.4(3 releases) on GitHub -
Assign tasks and issues to team members.
-
Managed issues related to Statistics and Categories
-
-
Enhancements to existing features:
-
Documentation:
-
Standardized the User Guide and Developer’s Guide.
-
-
Community:
-
Set up the basic structure for the project. (Creation of expenses classes): #67
-
-
Categories
Categories allow for organization of data, and improves the breakdown of information for statistics. For more information visit: https://github.com/AY1920S1-CS2103-T16-4/main/blob/master/docs/UserGuide.adoc#categories
Statistics
Switching to Statistics Table View : viewTable
Switches to the statistics table view. By default, viewTable will show the current month statistics.
Typing only the month in format [yyyy-mm] will show the breakdown of statistics by the specified month.
Carrying out any other Adding, Editing, Or Deleting Expense or Income command in the Statistics Table
screen will reset the Table to show the month of statistics that reflects the command carried out.
Format: viewTable [p/<RangeOfMonths>]
-
<RangeOfMonths>: The dates that you would like to display the statistics by. If you are interested in a range of months, you have to make sure that the startMonth and endMonth is separated by a comma,,. If you’re only interested in one month, specify the month in the formatyyyy/MM
Example Usage:
-
Let’s say you want to view the Statistics in table form for period 2018/01 to 2019/12. You then type in the command
viewTable p/2018-01,2019-12.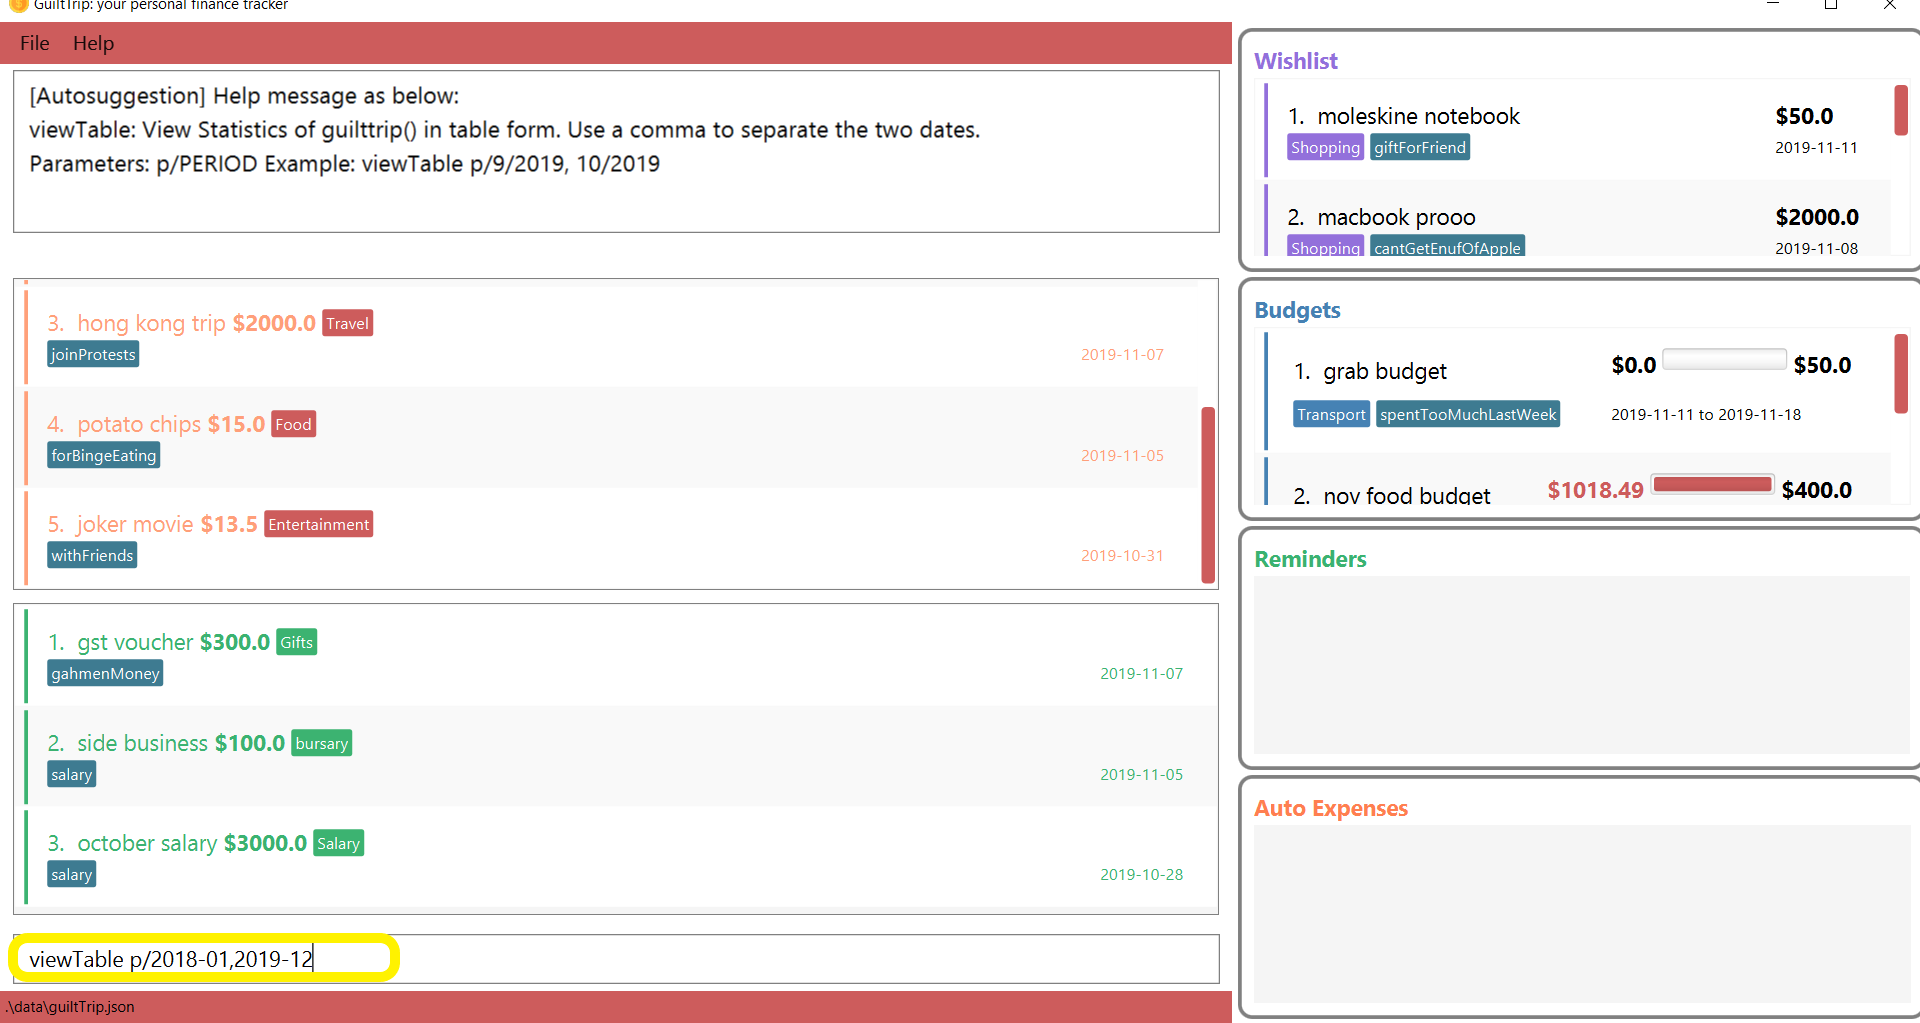
-
GuiltTrip will display to you the statistics for this period of time broken down in table form.
Other Examples:
-
viewTable p/2018-09 -
viewTable
Switching to Statistics Pie Chart View : viewPie
Switches to the statistics table view. By default, viewPie will show the current month statistics.
Typing only the month in format [yyyy-mm] will show the breakdown of statistics by the specified month.
Carrying out any other Adding, Editing, Or Deleting Expense or Income command in the Statistics Table
screen will reset the Table to show the month of statistics that reflects the command carried out.
The statistics by percentage will be rounded to the nearest 1 decimal place so as not to clutter the UI.
Format: viewPie [p/<RangeOfMonths>]
-
<RangeOfMonths>: The dates that you would like to display the statistics by. If you are interested in a range of months, you have to make sure that the startMonth and endMonth is separated by a comma,,.
Example Usage:
-
Let’s say you want to view the Statistics in pie chart form for period 2018/01 to 2019/12. You then type in the command
viewPie p/2018-01,2019-12.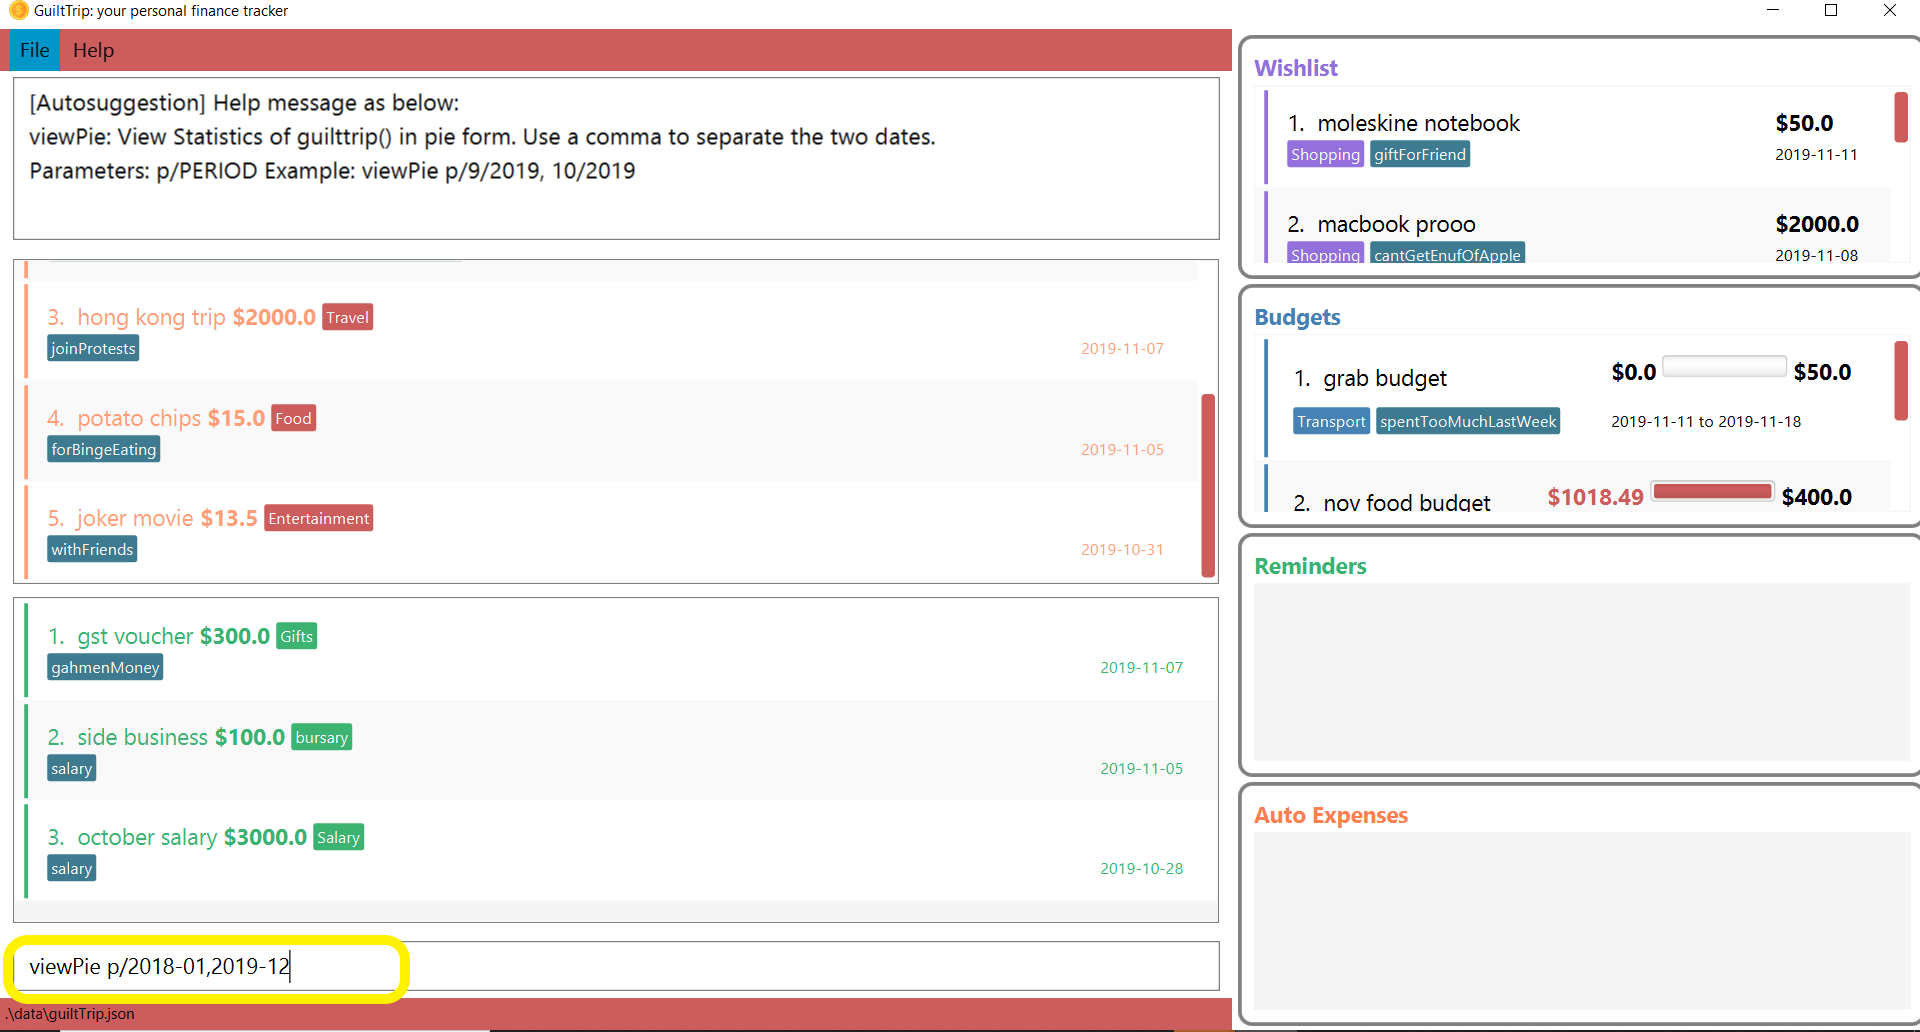
-
GuiltTrip will display to you the statistics for this period of time broken down in pie chart form.
| If the data category percentage is too small, it could be rounded off to 0.0% and there is a likelihood that it’ll be hard to see the portion of that category in the pie chart. |
Other Examples:
-
viewPie p/2018-09 -
viewPie
Switching to Statistics Bar Chart View : viewBar
Switches to the statistics table view. By default, viewBar will show the current month statistics.
Typing only the month in format [yyyy-mm] will show the breakdown of statistics by day by the specified month.
Carrying out any other command in the Statistics Bar Chart screen will reset the Bar Chart to show the current month
statistics for convenience of the user.
| As the bar chart is auto scaling to reflect the accuracy of the y-axis , if there is too large an expense for one day, it will be hard to see the amounts for other days. |
Format: viewBar [p/<SpecifiedMonth>]
-
<SpecifiedMonth>: The month and year in which you want to display the data by. It must be in the format[yyyy mm]with no dates and does not allow a range of months.
Example Usage:
-
Let’s say you want to view the Statistics in bar chart form for period 2019/10. You then type in the command
viewBar p/2019-10.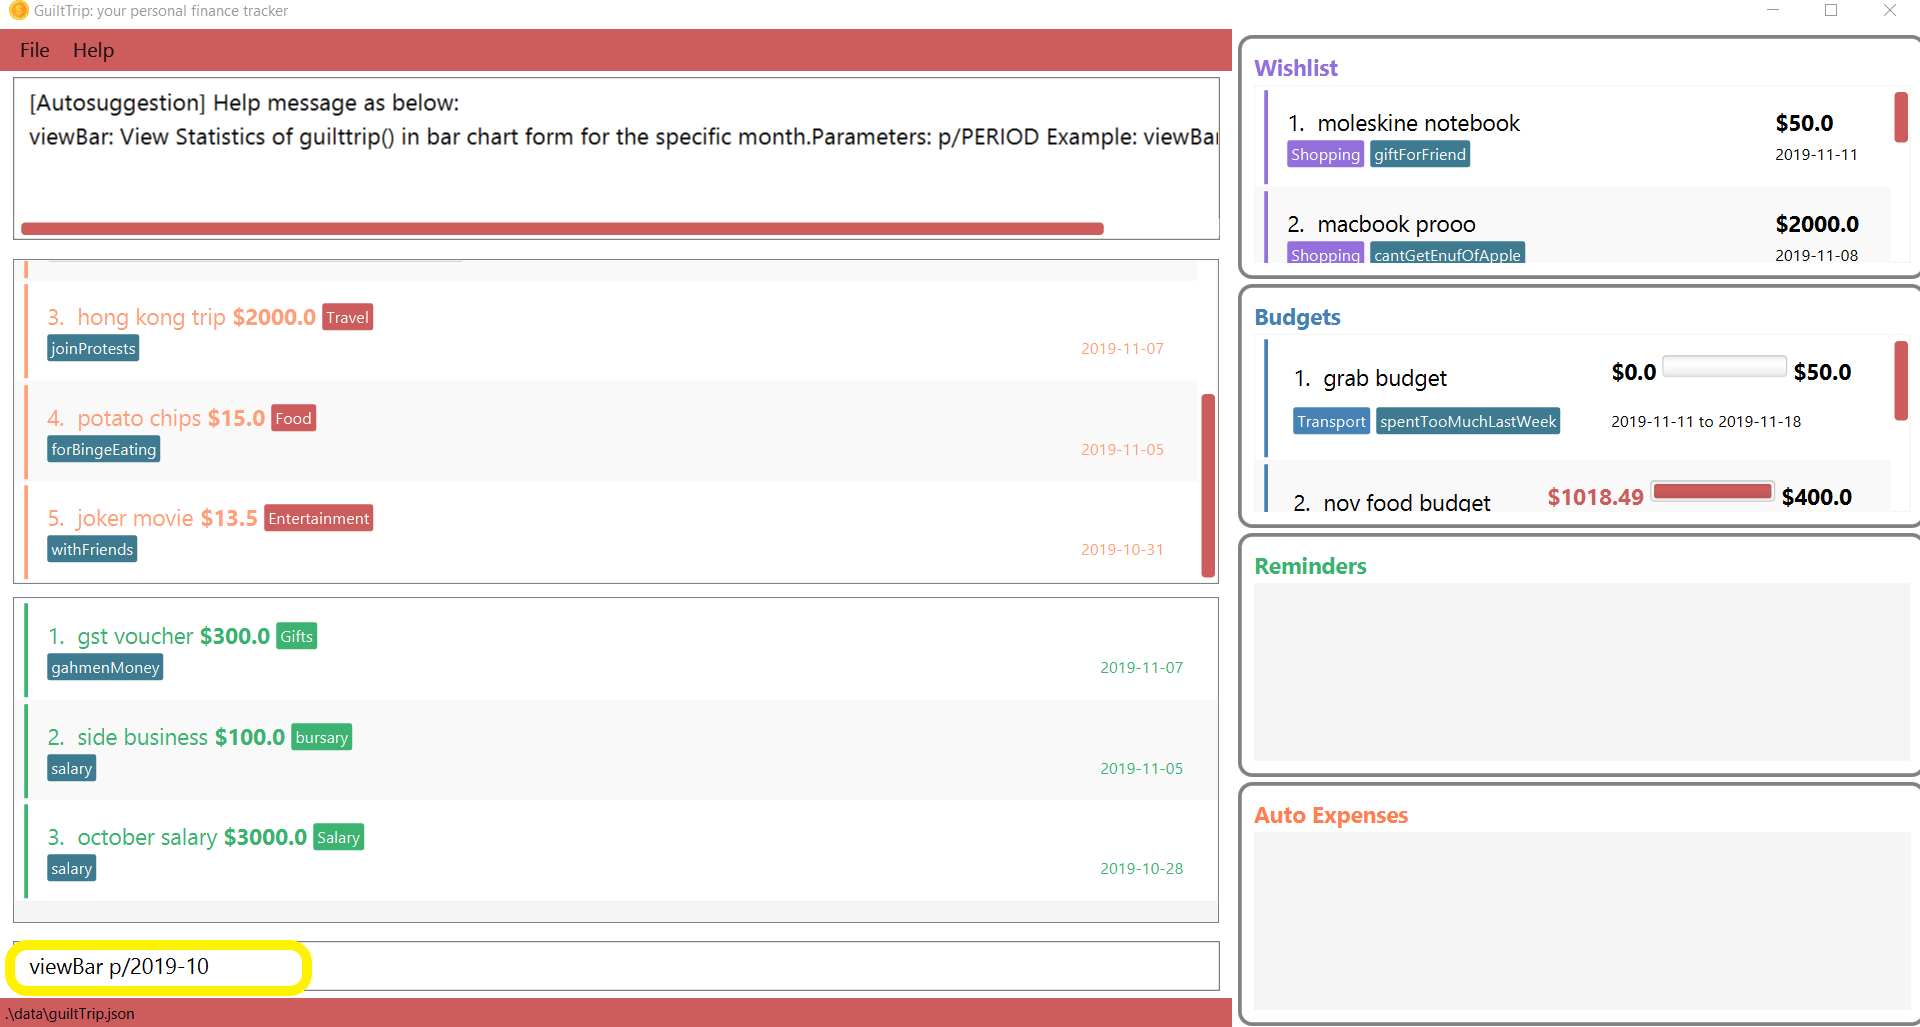
-
GuiltTrip will display to you the statistics for this period of time broken down in table form as shown below.
Other Examples:
-
viewBar p/2018-09 -
viewBar
Sorting and Finding
Sorting allows the user to organize GuiltTrip to sort what he wants to see. For more information visit: Link For Sorting Finding allows the user to organize GuiltTrip to filter out what he wants to see. For more information visit: Link For Finding
Contributions to the Developer Guide
Data Presentation: Categories
As the section for Categories is too huge, I included a small section on editingCategories command function. For more information: Categories
-
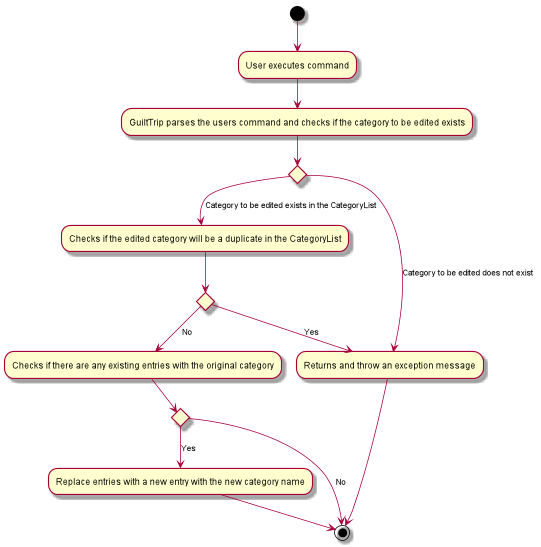
When editing a
Category, there is a need to check that the new Category added does not exist in the existing guiltTrip, hence the need forCategoryList#contains(Category)as well as a need to check if there are existing entries of the originalCategoryto carry out modifications on them.
Given below is an example of an activity diagram for editing a category to illustrate the point above.
Data Presentation: Statistics
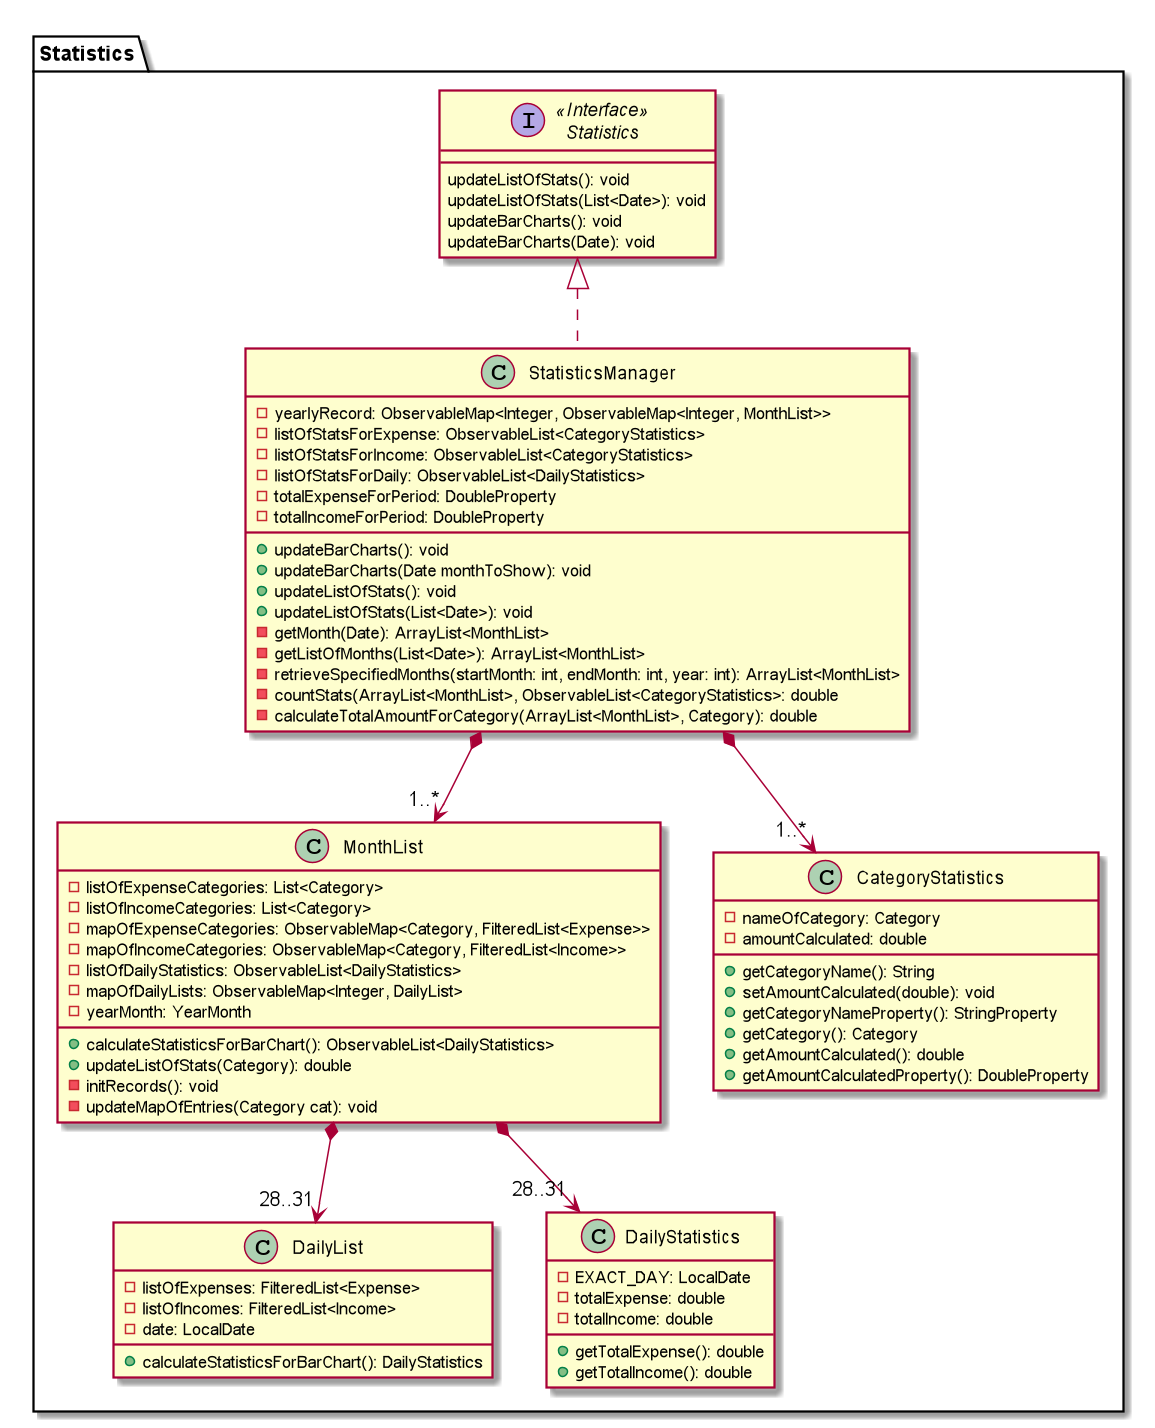
The Statistics class diagram is shown above. Many of the operations are handled by StatisticsManager. The two main operations for calculation of Statistics are:
-
StatisticsManager#updateListOfStats(rangeOfDates): Calculates the statistics for categories according to the range of dates specified. Calls onMonthList#updateListOfStats(Category)to calculate the list of Stats across Categories in thatMonthList, thus updating the list ofCategory Statistics. -
StatisticsManager#updateBarChart(monthToCalculate): Calculates the daily statistics according to the month specified. Calls onMonthList#CalculateStatisticsForBarChart()which will call onDailyList#CalculateStatisticsForBarChart()to update the list ofDailyStatistics.
Implementation: (Statistics) - ViewPieChart/ViewTable Command
The ViewPie and ViewTable commands are a unique case as they both depend on CategoryStatistics. StatisticsManager has two ObservableList of CategoryStatistics, one for Expense, listOfStatsForExpense
and one for Income, listOfStatsForIncome.
The StatisticsPieChart and StatisticsTable in guiltTrip listens to these two ObservableList, and will update accordingly. Hence all operations
which involve calculation of category statistics needs to update this ObservableList by replacing its entries so as to
update the relevant Pie Chart and Table in the Ui.
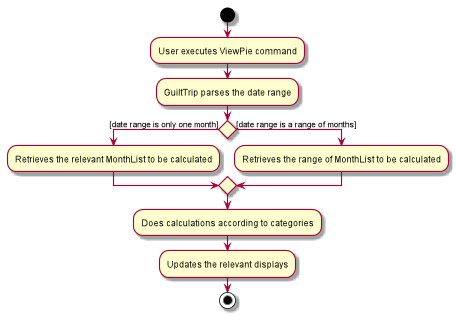
The overview of this process can be found in the Activity Diagram above.
The details of the process is as below:
-
The user executes the command
viewPie p/2019-09,2019-11 -
LogicManageruses theguiltTripParserclass to parse the user command. -
This results in a
viewPieChartCommandobject which is executed by theLogicManager. -
The
viewPieChartCommandcalls theModel#updateListOfStats(RangeOfDates)'s method which then callsStatisticsManager#updateListOfStats(RangeOfDates)method to calculate the statistics for that type. -
StatisticsManager#updateListOfStats(RangeOfDates)detects that the size of the list is 2 and calls#getListOfMonths(RangeOfDates)to retrieve the list ofMonthListMonthListToCalculate from start Date to End Date fromyearlyRecord, theObservableMapinsideStatisticsManager. -
StatisticsManager#updateListOfStats(RangeOfDates)then callsStatisticsManager#countStats(MonthListToCalculate, listOfStatistics), which will calculate the list of statistics for expense and income categories and create many newCategoryStatisticsobjects to save the data of the calculated Statistics for each Category. -
StatisticsManager#countStats(MonthListToCalculate, listOfStatistics)will replace the all theCategoryStatisticsobjects in theObservableListofCategoryStatisticswith the newly calculatedCategoryStatisticsobjects. -
As the
ObservableListis updated, the PieChart and Table which uses thisObservableListis also updated, leading to them being updated. -
Finally,
StatisticsManager#countStats(MonthListToCalculate, listOfStatistics)will set the new TotalExpense and TotalIncome values to the new values calculated, which will also update theUifor Stats which displays the total expense and total income. -
The result of the command execution is encapsulated as a
CommandResultobject which is passed back to theUi -
Logicreturns theCommandResultobject.
Given below is the Sequence Diagram for interactions within the Logic component for the execute("viewPie p/2019-09,2019-11") API call.
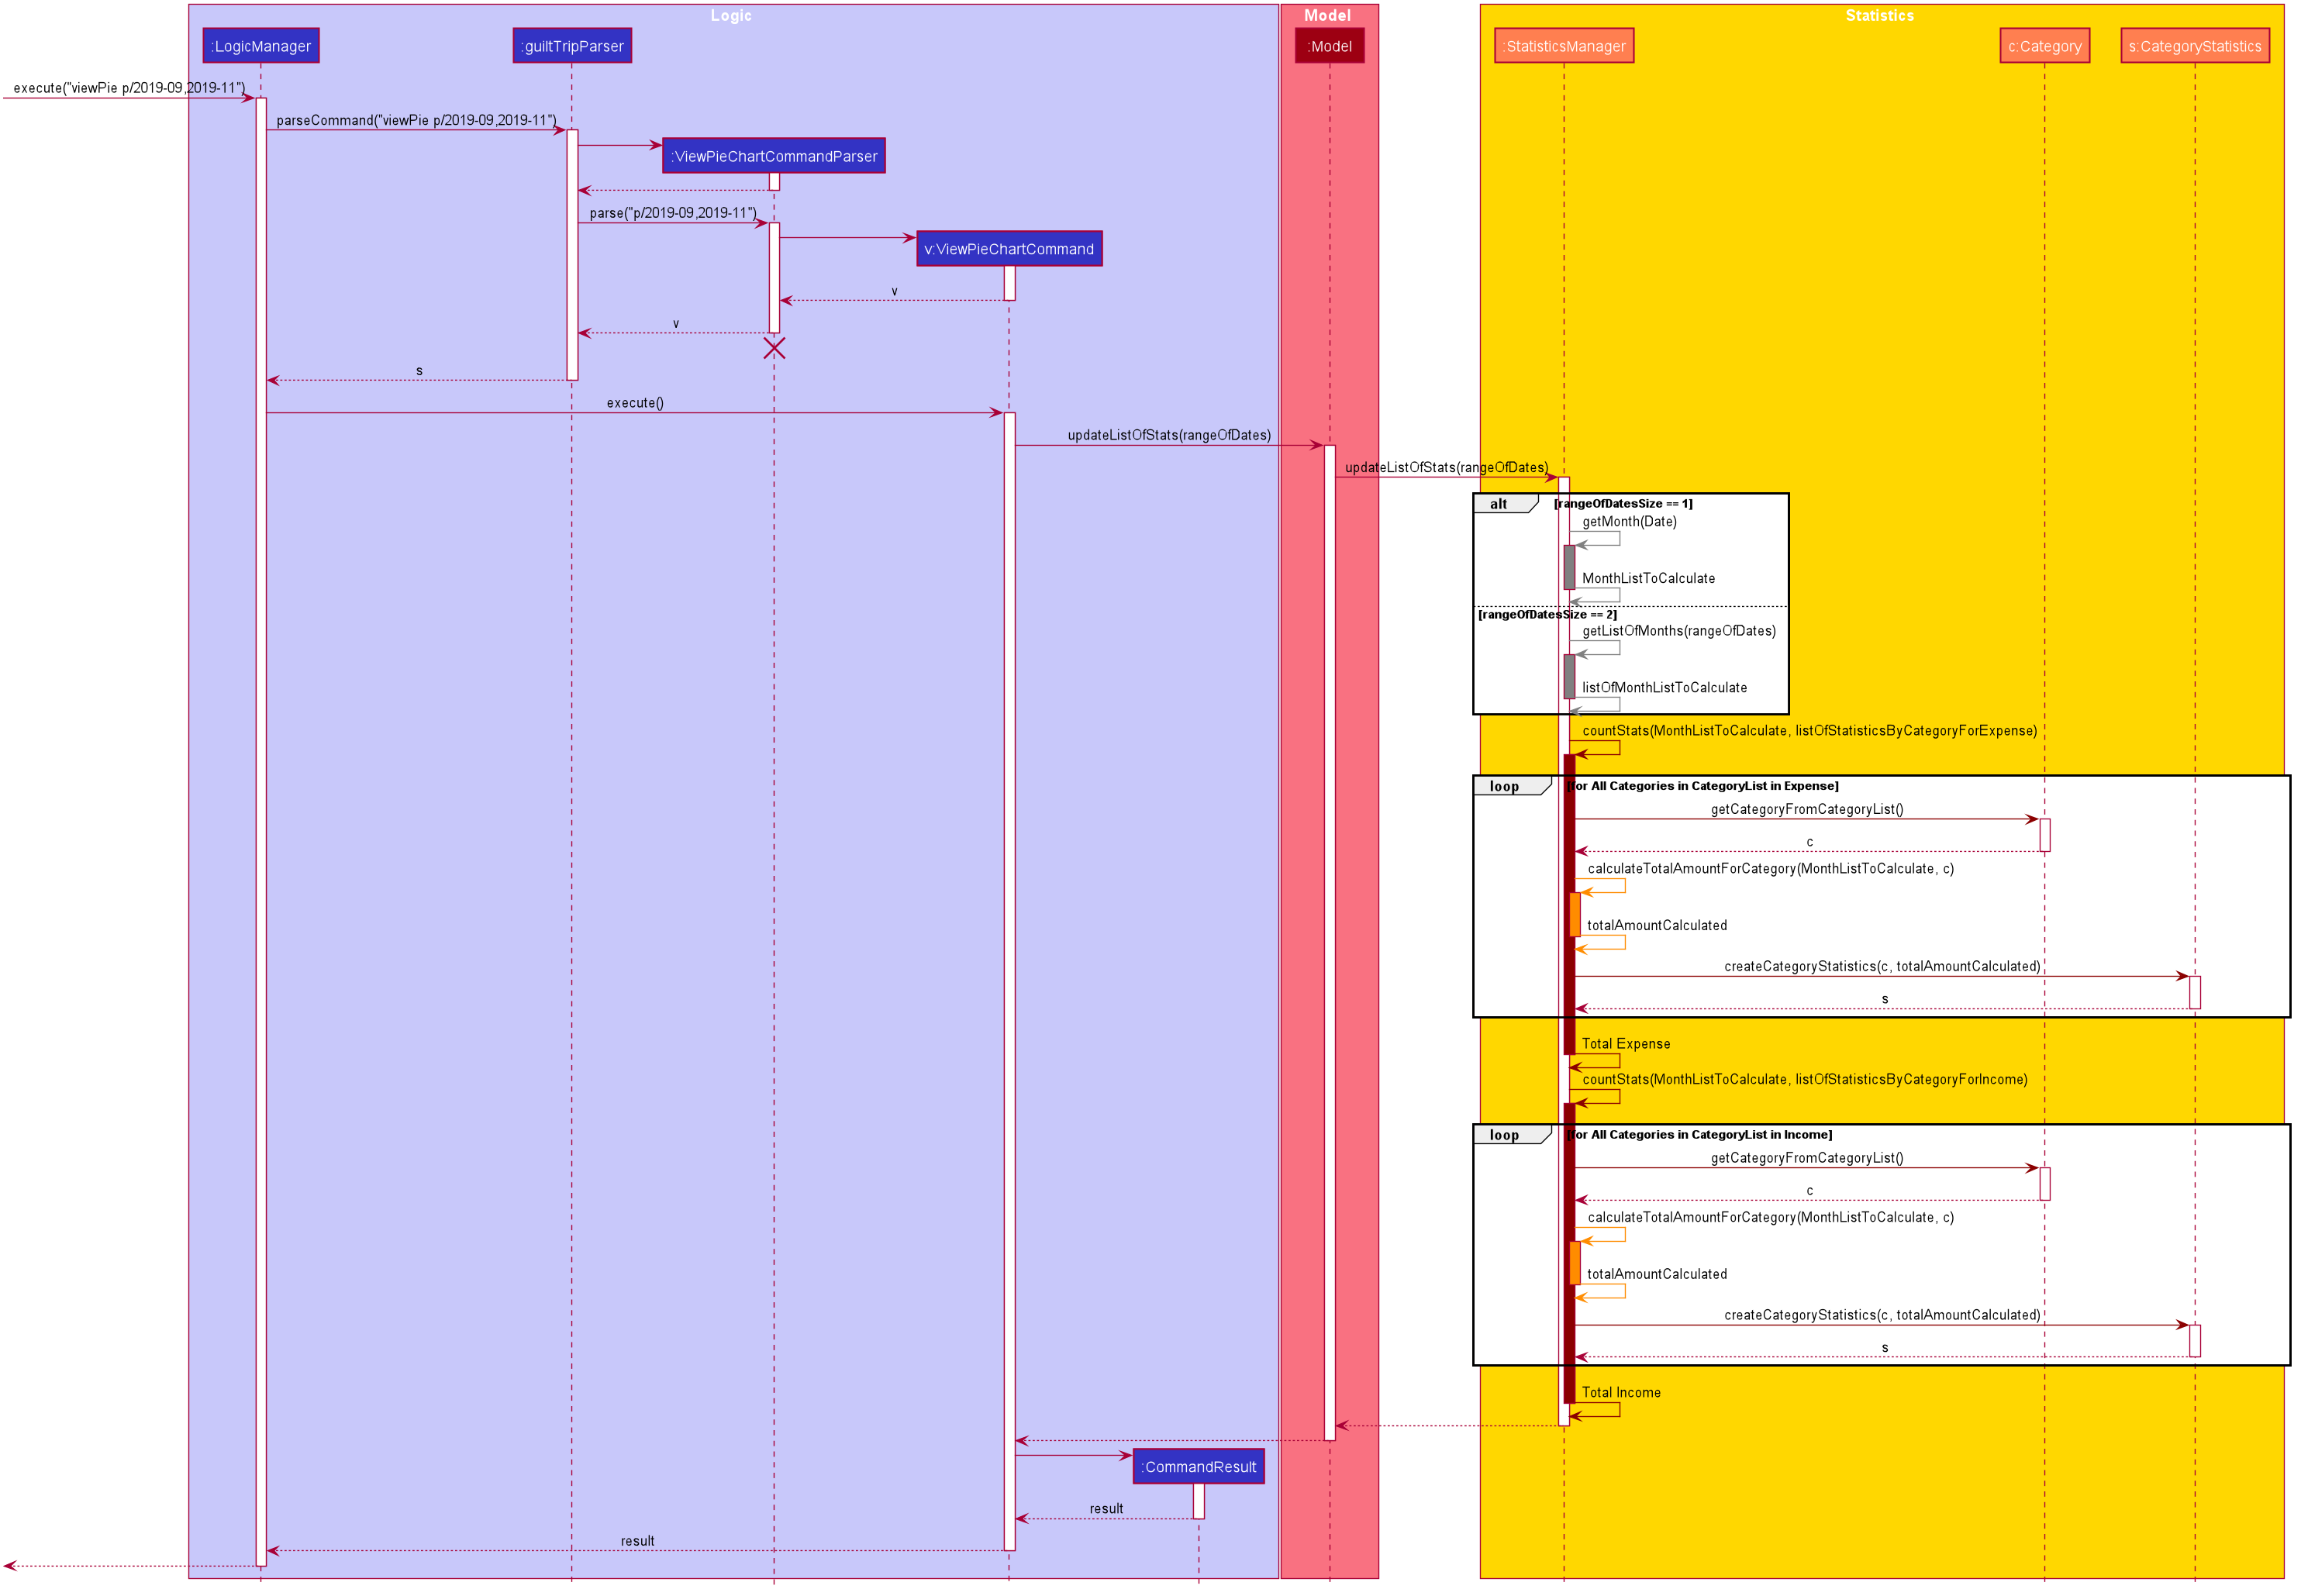
viewPie p/2019-09,2019-11 CommandImplementation: (Statistics) - ViewBarChartCommand
Similar to ViewPie and ViewTable, the StatisticsBarChart class listens to the ObservableList of DailyStatistics and will update
according to changes in it. Hence all operations which involve calculation of daily statistics needs to update this ObservableList by replacing its entries so as to
update the relevant Bar Chart in Ui. Further elaboration can be found at View-Bar-Chart-Elaboration.
Design Considerations: Statistics
Aspect: Calculation of Income and Expenses
-
Alternative 1: Set a predicate on the filteredlist of income and filteredlist of expense to filter out the number of income and expenses which are within the time period of the statistics query.
-
Pros: Easy to implement.
-
Cons: May have performance issues in terms of runtime, as if multiple queries are carried out in a row which are the same, recalculation needs to be done every single time.
-
-
Alternative 2(current choice): Have MonthList and DailyList classes which store the specific filteredlist of expenses for that month. This is a new filteredlist which observes the changes in the original list of expenses and is updated if a new expense is added which corresponds to the month.
-
Pros: Will be faster as initiating the expenses in the MonthList is only done at the start of the application. Any queries after that just refers to the already constructed MonthList. It is also structured as calculations of expenses now involve going to the related MonthList to carry out the calculations.
-
Cons: More complicated to implement.
-
| There isn’t a need to use YearList as most users will usually want to see their statistics breakdown over a period of a month rather than over a period of years. |
Aspect: Updating of charts whenever add delete edit commands is called
-
Alternative 1: Disallow non-stats commands in the stats window.
-
Pros: Easy to implement.
-
Cons: May not be intuitive for the user and creates hassle.
-
-
Alternative 2(current choice): Adds a Listener to the list of filtered expenses. The listener will update the relevant charts whenever it detects that there is a change in the expenses or incomes.
-
Pros: Intuitive for the user.
-
Cons: Takes a toll on the time complexity if large bulks of data was added through AutoExpense.
-
Proposed Extension
-
Currently Statistics Breakdown doesn’t show details like trends across months. A future implementation could involve showing the user what category of spending increases across the months. For example, it could reflect that spending for category Entertainment increased the most in the past months.
-
Bar Chart can be further improved to show analysis of breakdown of category by day and observe trends for the user. For example, it could notice that the user has been spending a lot every Tuesday and alert the user about it.